

The histogram is a valuable tool on your camera and should also be your go-to tool when correcting exposure in Photoshop. It makes it easy to identify areas that have become too bright or dark as you edit a photo.
In this tutorial, we will discuss how to use a histogram in Photoshop and the different places you can find them in the program.
How To Read A Histogram In Photoshop
Step 1: Go To Window > Histogram To Open The Histogram In Photoshop
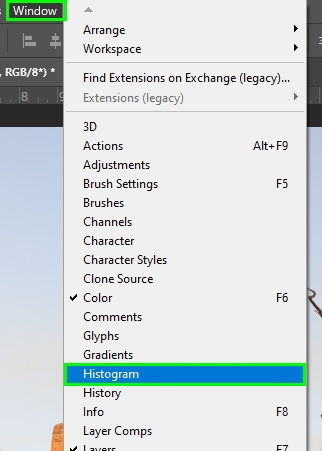
To access the Histogram Panel in Photoshop from the main workspace, go to Window > Histogram.
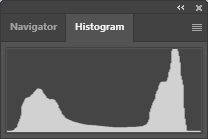
The Histogram opens in the top-right corner of your workspace or as a floating panel.
You can view additional information from the histogram by clicking on the hamburger menu and choosing Expanded View.
Step 2: Reading The Histogram In Photoshop
A Photoshop histogram is a graph representing the luminance of pixels in a given image. A histogram has an x-axis (horizontal side) and a y-axis (vertical side). On the horizontal side, you find luminance values of pixels running from 0 to 255 (from left to right).
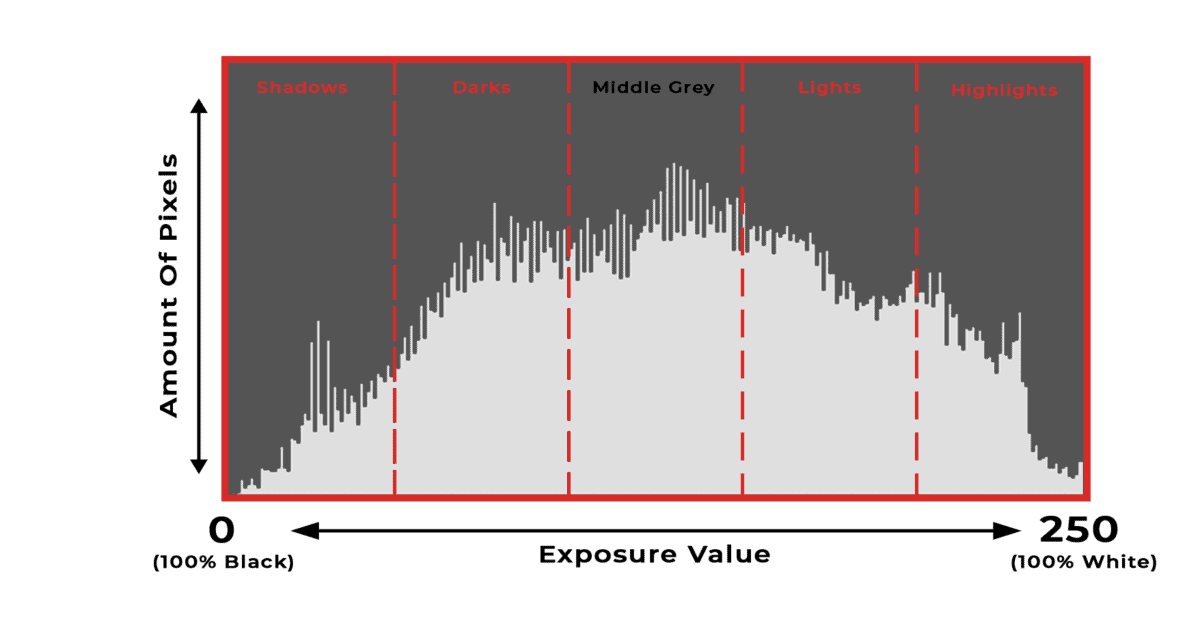
At point 0 (left edge of the graph), there is no luminance, so pixels are black. At point 255 (right edge of the graph), there is a luminance of 100%, so pixels are white. You can find intermediate luminance values (mid-tones) in the middle of the graph.
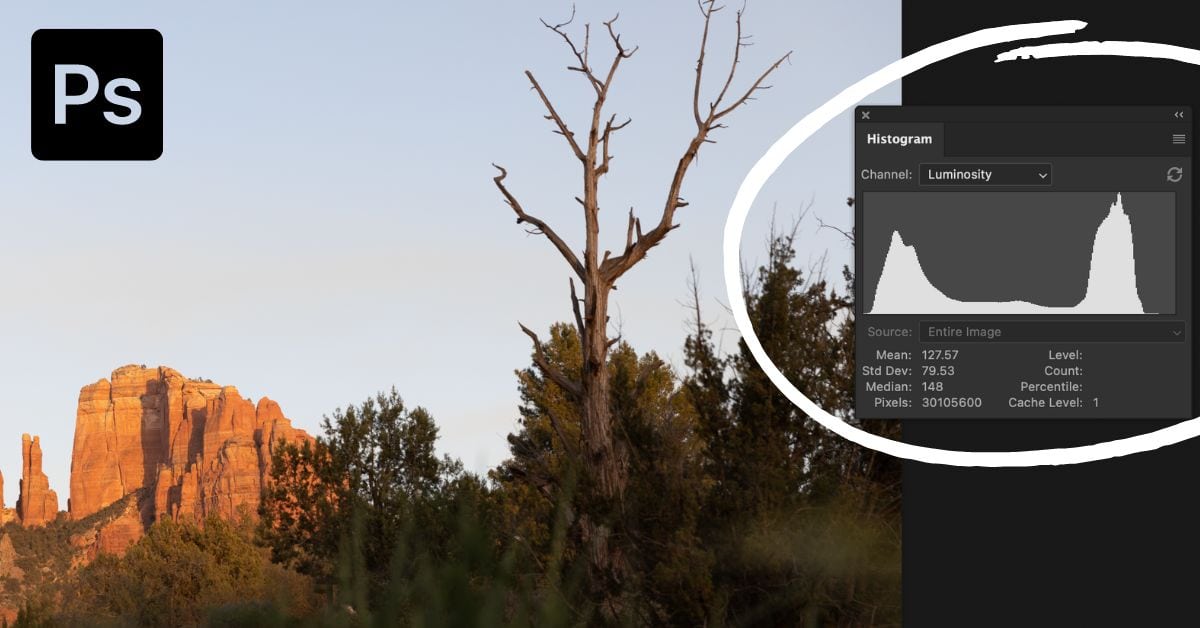
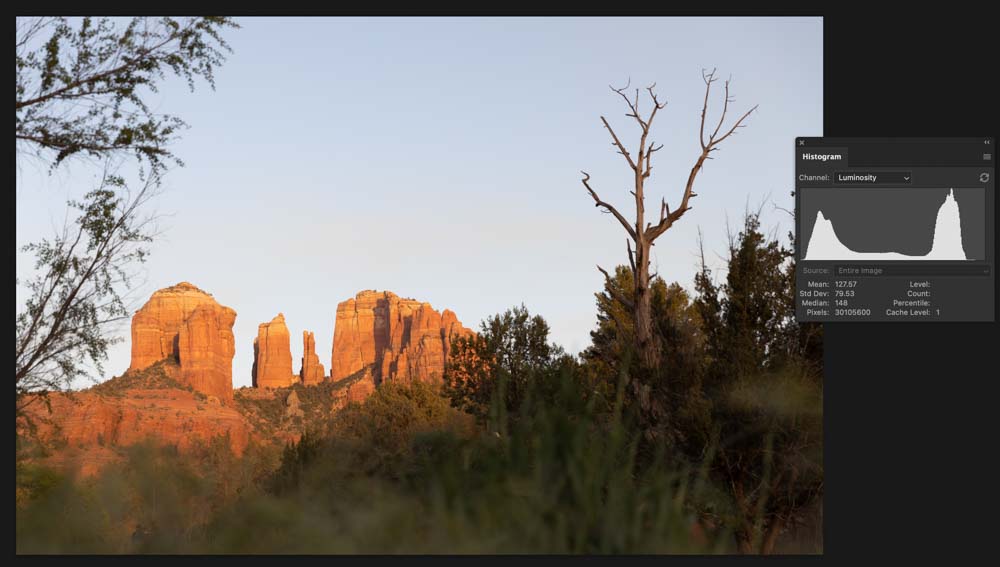
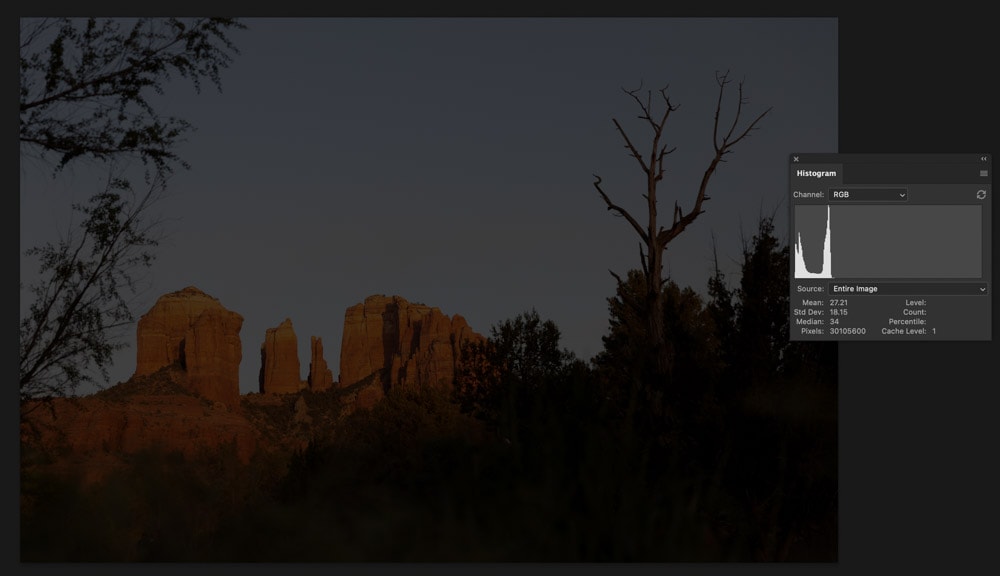
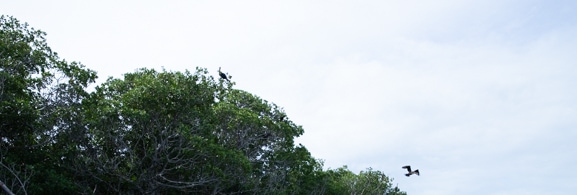
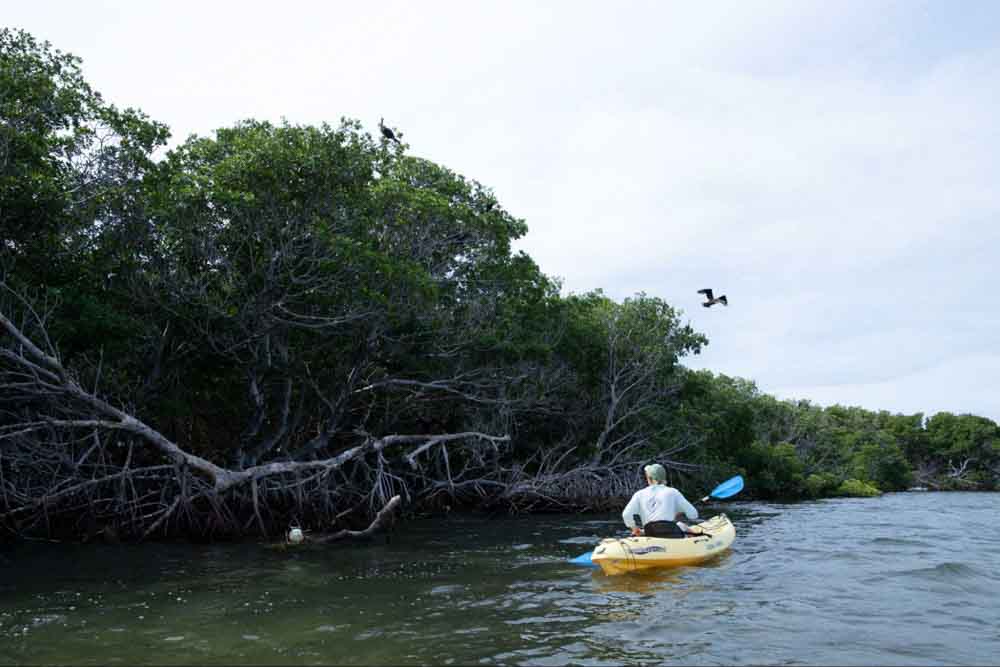
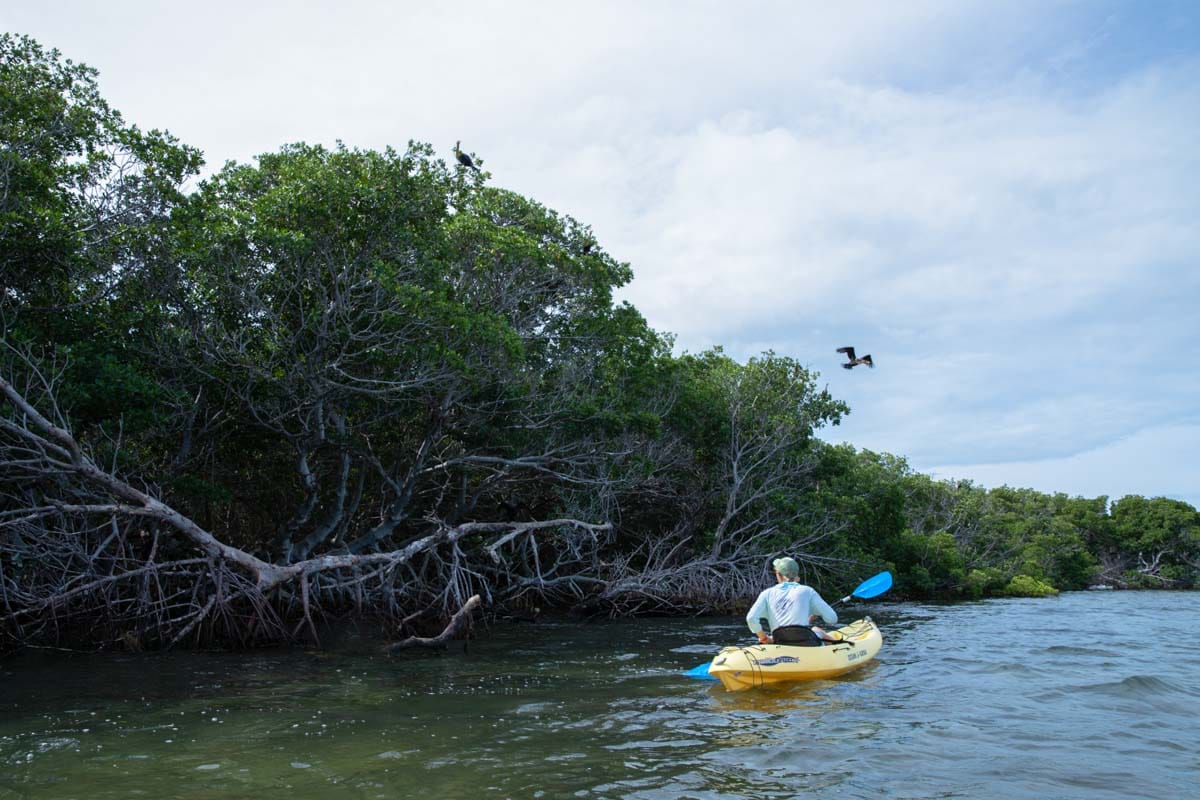
I will read the image below using the histogram to help you better understand the concepts I just introduced. The first thing you can infer from this histogram is that there are no blown-out areas in the photo because the histogram shows no clipping.
Clipping refers to areas with totally white or black pixels. If pixels touch either the right or the left edge of a histogram, the image has clipping. Clipping causes that black or white area to contain no data, which can lower the quality of your image. As such, it is recommended to avoid clipping where possible.
Many histograms have high pixel density on a specific side of the graph, and some even have peaks on both sides. You can see a concentration of pixels in two spots on the graph, forming two peaks. Pixels are concentrated on the left side of the histogram. That part of the graph contains low luminance values, which means those pixels are dark.
There are also many bright pixels on the right side of the histogram. You can tell this because that area contains high luminance values.
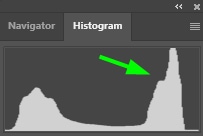
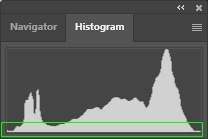
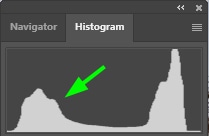
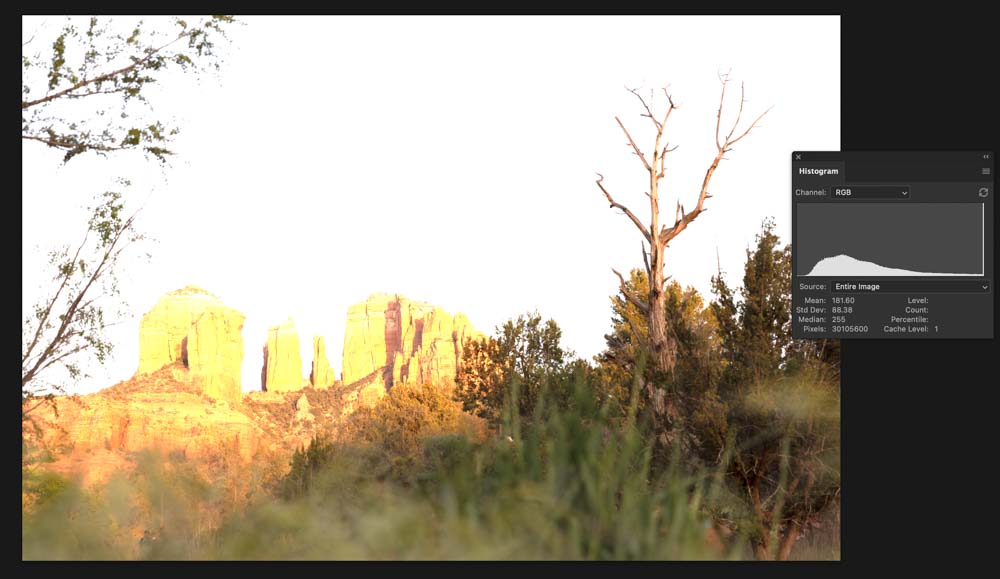
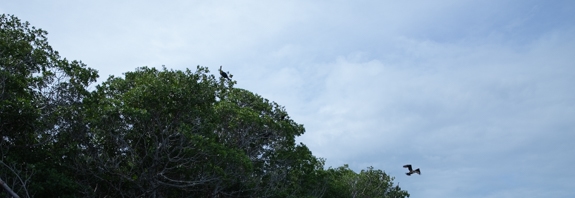
Below are a few examples to easily see how the histogram changes as the exposure is adjusted:
How To Read A Histogram In Camera Raw
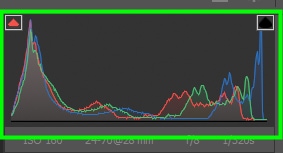
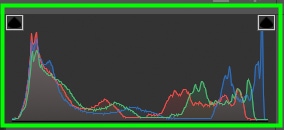
To locate the histogram in Camera Raw, go to Filter > Camera Raw Filter, and the histogram will appear in the top right corner. The luminance values in the Camera Raw histogram are divided by channel.
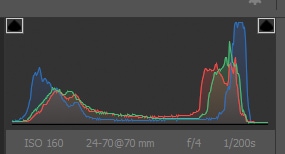
The histogram in the graph above displays the luminance values of the Red, Green, and Blue channels.
Using A Histogram In Photoshop To Edit Photos & Prevent Clipping
Step 1: Open Your Image In Camera Raw And Use The Camera Raw Histogram
The best histogram to guide your photo editing is the Camera Raw histogram. When you open a RAW file in Photoshop, it converts the image to TIFF format, which means that you can push the exposure further in Camera Raw without losing details
First, open your image in Camera Raw, as you learned in the first section of this tutorial. Then, locate the histogram.
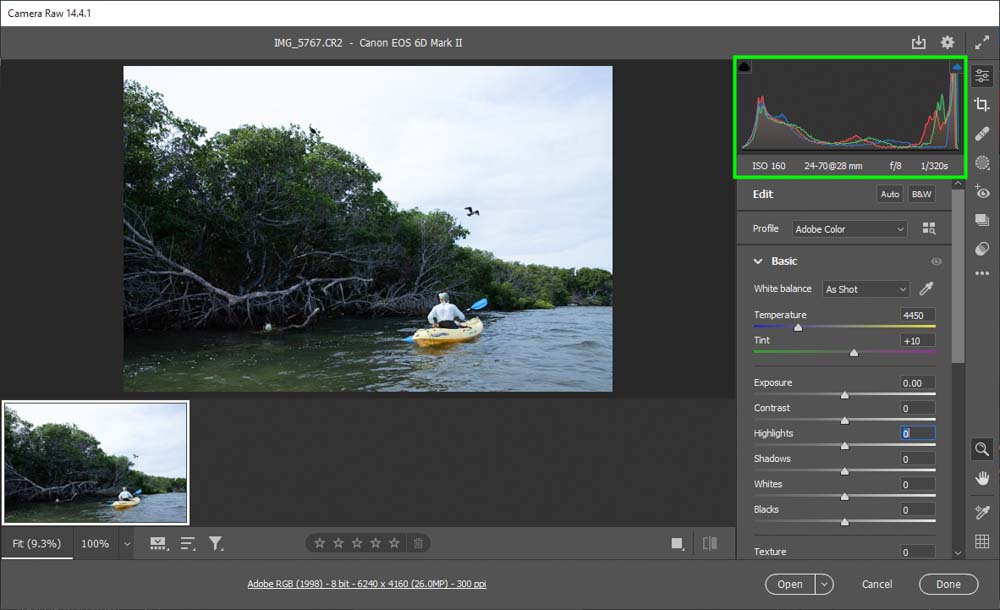
Step 2: Read The Histogram And Look For Flaws
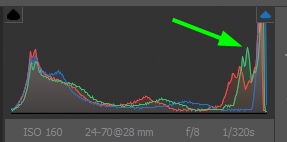
The histogram below shows a concentration of pixels touching its right side. That shows the image has highlight clipping. Many pixels are also concentrated on the left side of the graph. This means data is heavily pushed into the shadows. Additionally, there are only a few mid-tone pixels, indicating the image might lack details.
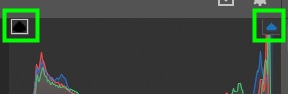
Step 3: Turn On The Clipping Warnings With O For Highlights and U For Shadows
The two arrows at the top of the histogram can optimize your editing workflow. The left arrow warns you about clipped shadows, while the right arrow warns you about clipped highlights.
These warnings are extremely useful for editing photos because they prevent you from under or overexposing parts of your photo. Press O on your keyboard to turn on the highlights warning clipping or U to turn on the shadows warning clipping.
Step 4: Adjust The Sliders In The Camera Raw Workspace To Solve The Luminance Problems
Adjusting the sliders on the right side of the Camera Raw workspace can solve the problems the histogram points out.
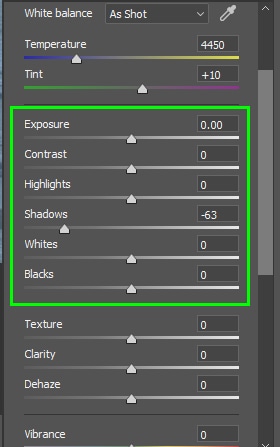
In my case, I turned the Exposure down a little (-90), which made a significant difference in my image.
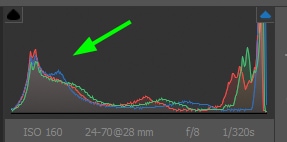
When reducing the exposure, the clipping disappeared.
Although clipping disappears when you adjust the exposure of your image, the highlights or shadows might be affected once you fix the exposure. If that happens to your picture, adjust its shadows or highlights using the Highlights and Shadows sliders.
In my case, I increased the brightness of the shadows to balance the image’s luminance.
That also balanced the histogram.
Keep adjusting the whites, highlights, blacks, and shadows sliders to refine your exposure and build more contrast into the photo.
As you can see, histograms are valuable tools that help you make the most out of your photos and speed up your editing process.
