How To Read And Use A Histogram In Your Photography
The histogram is one of the most important tools for photographers. It helps you to see your exposure through a graph-like display that tells you whether your image may be too bright or too dark. A histogram is a crucial tool to avoid clipping in your photography and make sure you capture the best exposure possible. There are a ton of great uses behind this tool, but it’s all completely useless if you don’t know how to read a histogram.
In this article, I’ll share exactly how you can read a histogram and ways to utilize it in your photography. Let’s jump in!
What Is A Histogram
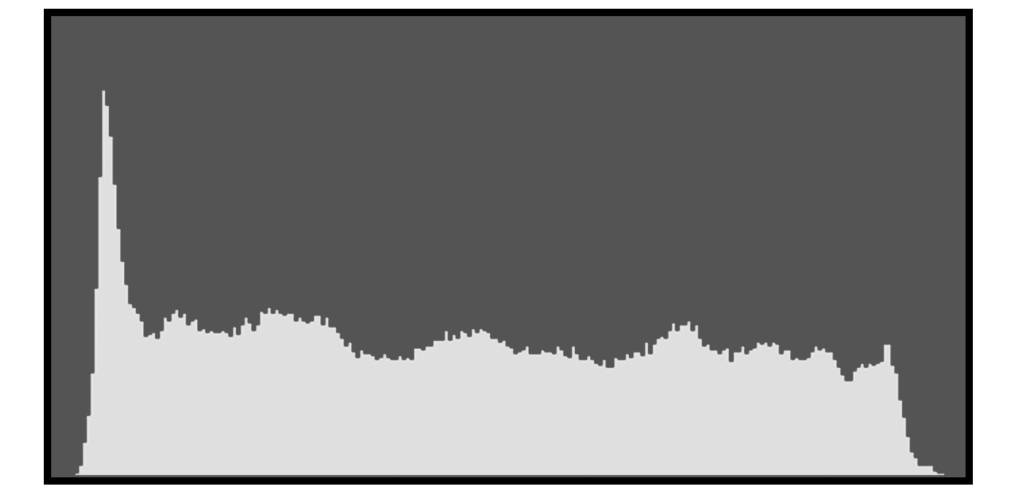
If you do one google search for histograms, you’ll end up at a bunch of math-related websites that make absolutely zero sense in the world of photography. Even when you google the definition for ‘histogram’, the result is:
“A diagram consisting of rectangles whose area is proportional to the frequency of a variable and whose width is equal to the class interval.”
If that made absolutely zero sense to you as well, don’t worry, I’m right there with you. Thankfully for us photographers, there’s not any critical thinking involved when using a histogram.
In photography, a histogram gives you a visual display of the exposure values of all the pixels in your image. It’s rectangular in shape and broken up into 5 different sections to represent changes in brightness.
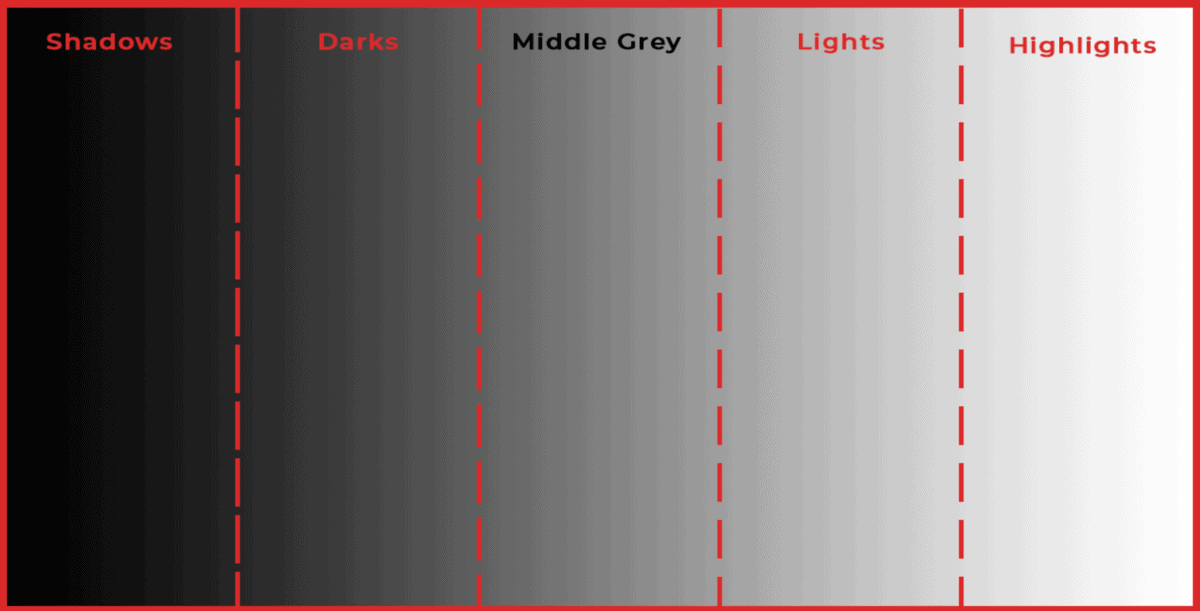
Inside the histogram is an almost spikey-looking graph that constantly changes with every photo you take. These little spikes represent the exposure values seen throughout your entire photo.
How To Read A Histogram
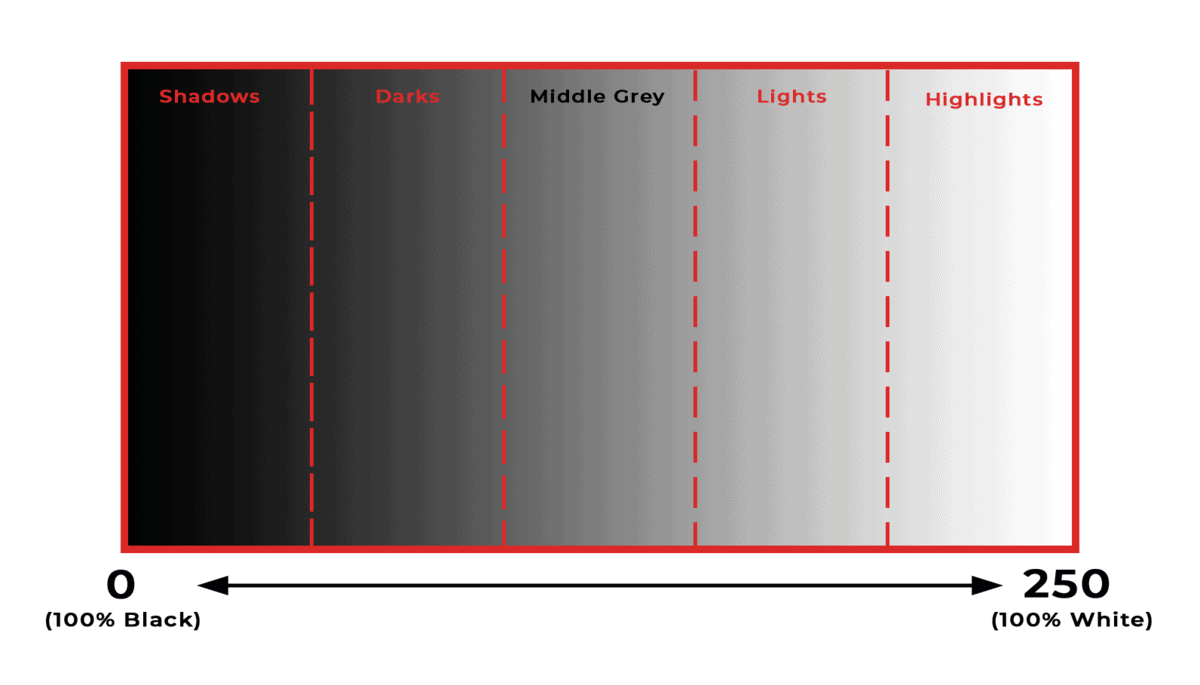
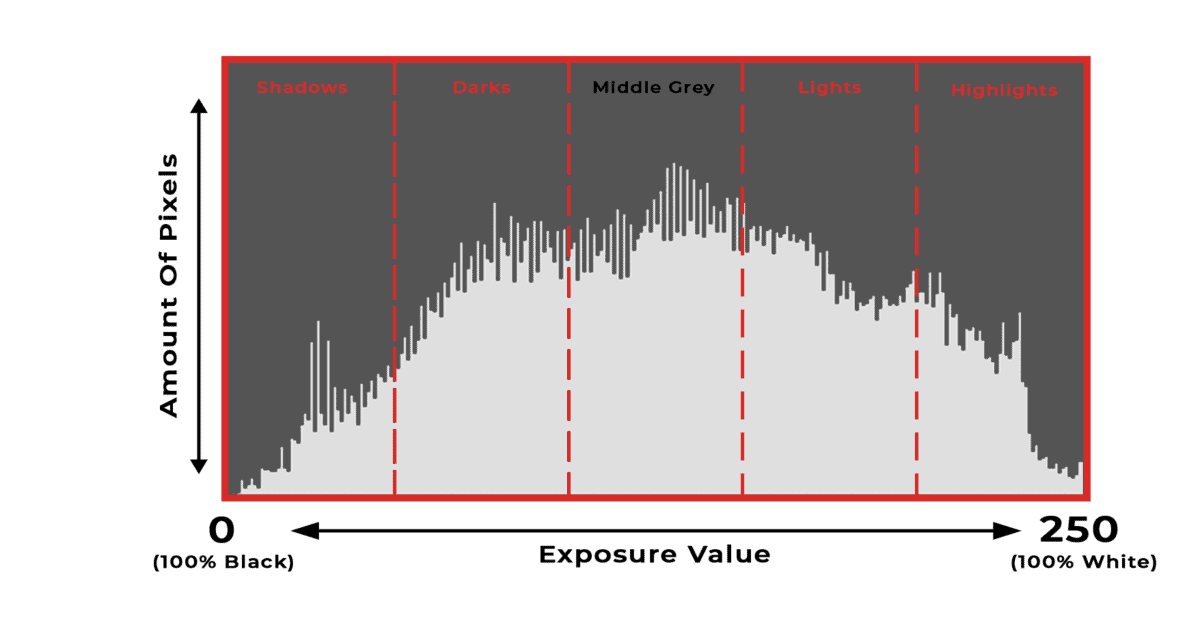
To learn how to read a histogram in photography, you only need to remember two main things. Horizontally, your histogram will tell you how bright or dark the pixels in your image appear. This change in exposure ranges from 100% black on the left to 100% white on the right. Between black and white, 250 different tones of grey represent your exposure. 0 represents black, while 250 represents white.
Now looking vertically, your histogram will show you how many pixels are being displayed at a certain tone ranging between 0 and 250. If there are more pixels in a specific exposure range, there will be a sharp spike on your histogram. When you’re taking a picture, there is a wide range of exposures throughout your photo. This causes the information of your image to spread out across the width of your histogram. Each little spike represents a different exposure value of your photo.
I know this can be hard to wrap your head around, so let me give you a more visual example of your histogram in action. Let’s say you have a completely black photo. There’s no information to be shown except the color black. If you look at the histogram, notice the sharp spike on the left side. This sharp spike is telling us that a whole lot of pixels are at 0 (aka 100% black) on the histogram. Since there aren’t any other spikes of pixels, it means that there are no other tones in the exposure range beside black. Below are two examples of a completely black image and a completely white image. Note how the histogram reads differently.
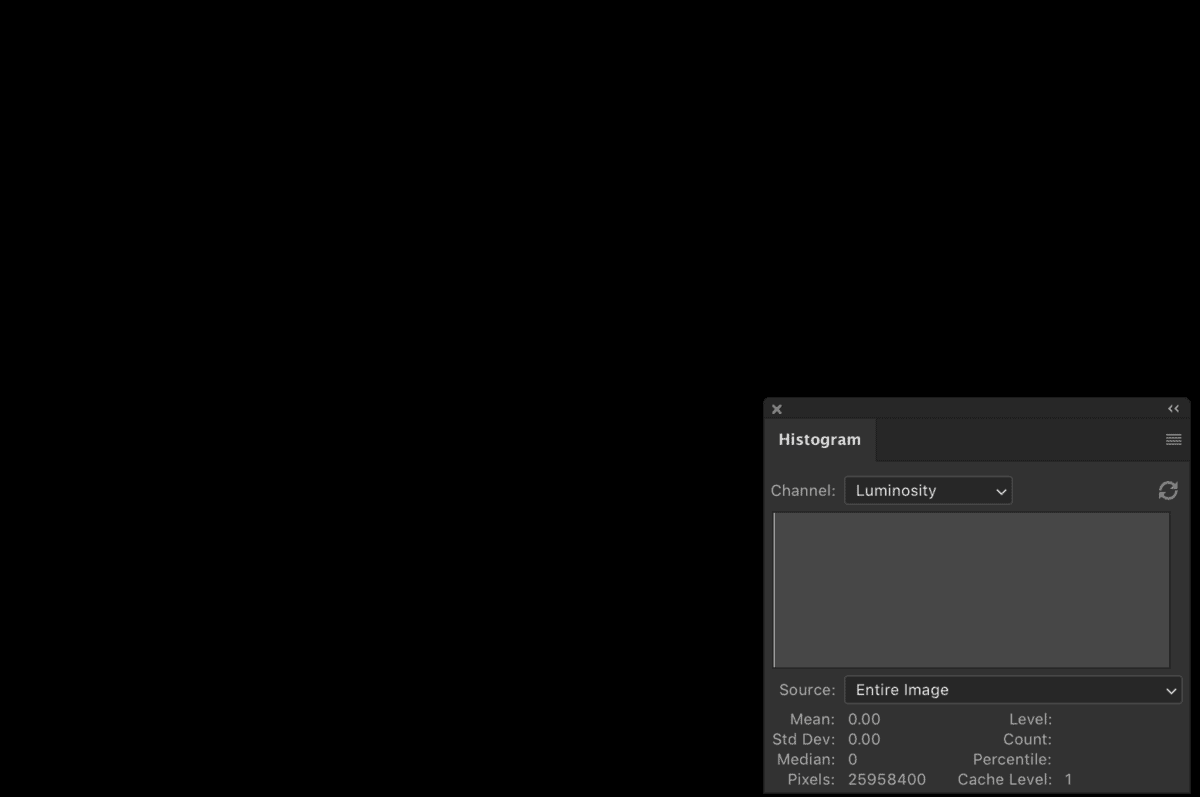
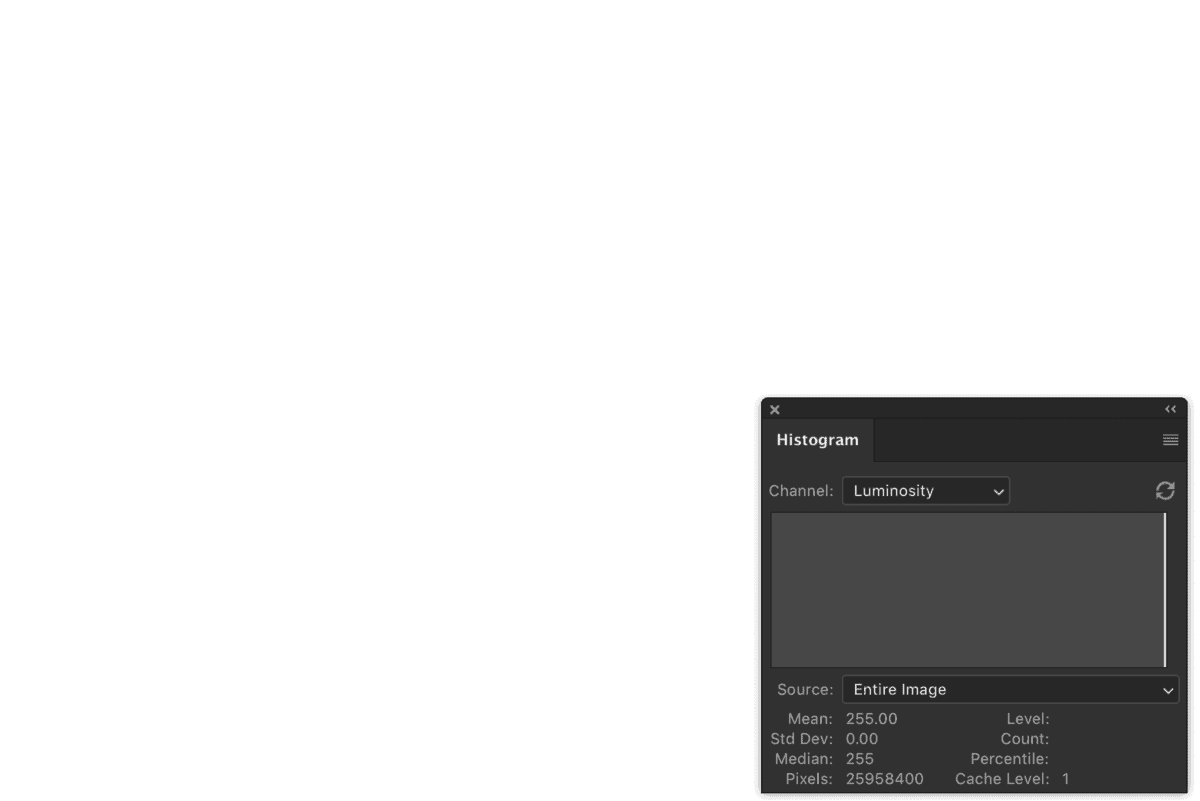
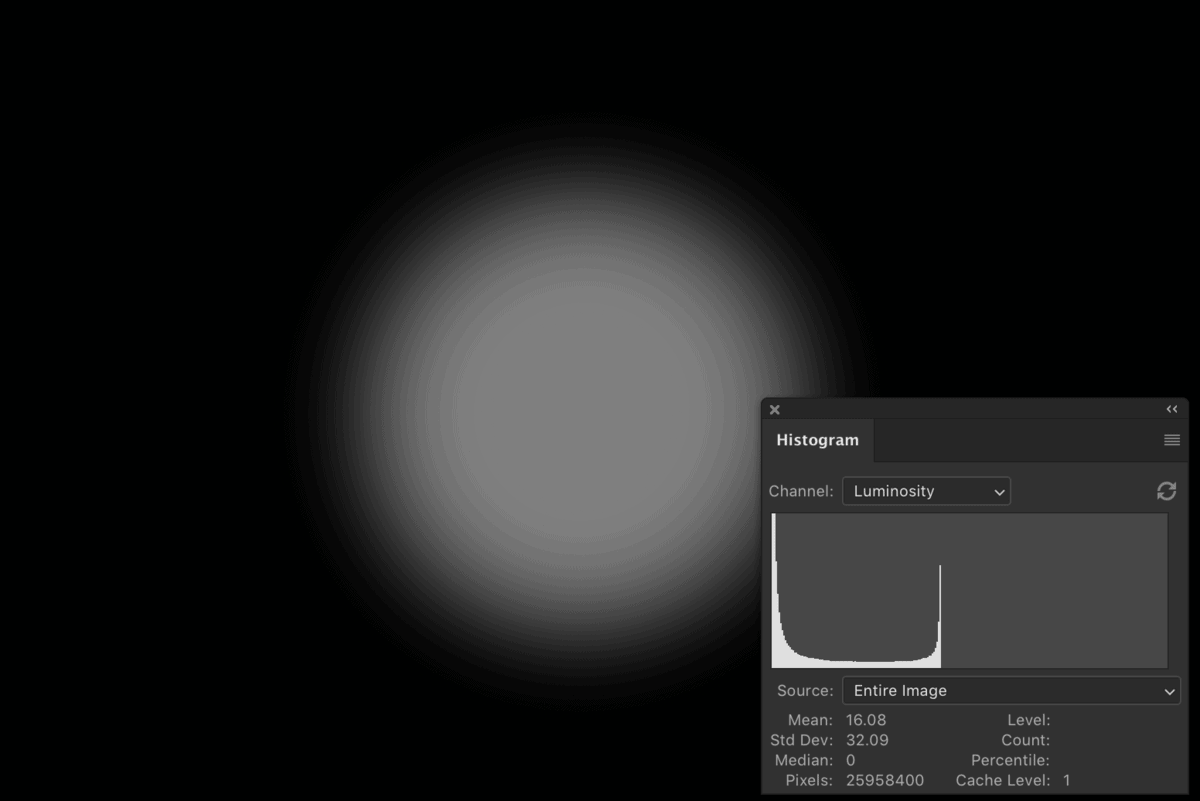
Now let’s see what happens if we add a small amount of grey to the middle of this photo. Look how suddenly there is a spike of pixels in the middle of the histogram. This spike represents the grey dot that was added to the black image.
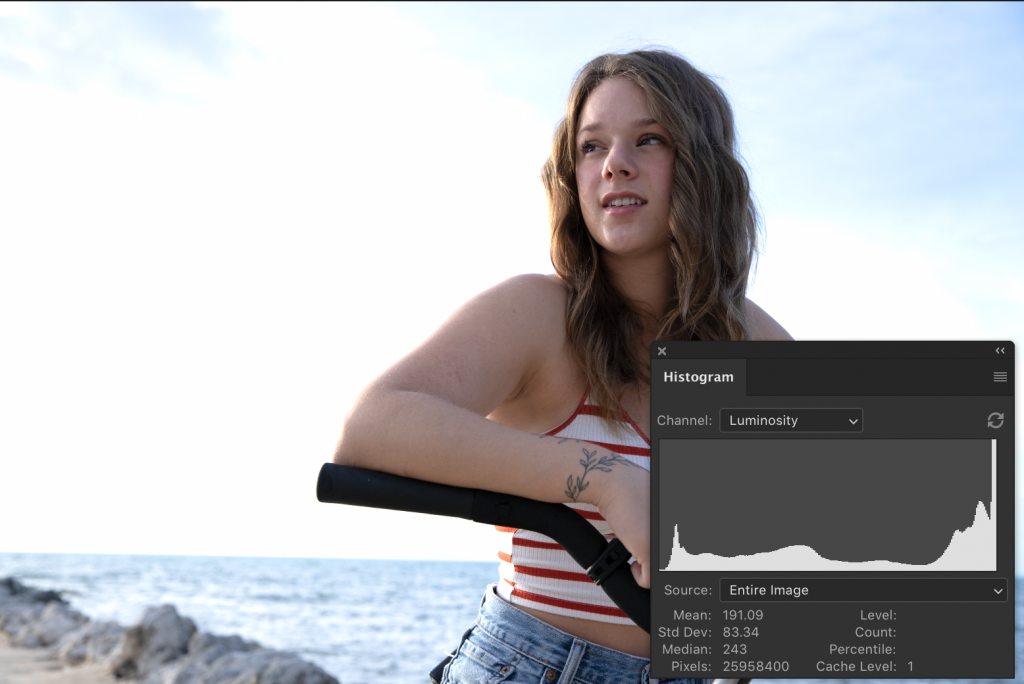
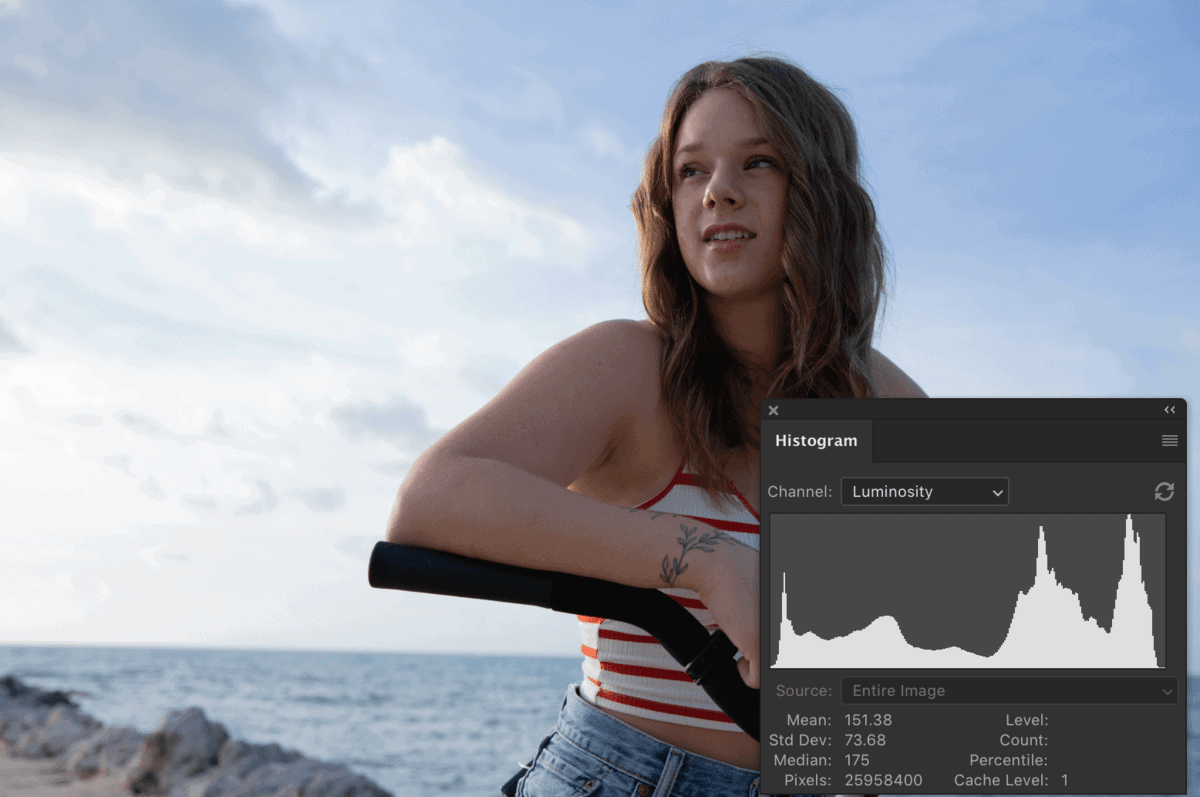
Once you understand how a histogram displays information at the most basic level, it’s easier to visualize what it’s telling you on an actual photo. Below is another example of the histogram, this time to represent an actual photo. Now there are a lot more spikes of pixels across the histogram since there are more tones of exposure in the image. When reading a histogram, you want to focus on the overall shape and position of the pixels to give you an idea of the exposure.

By looking at the general shape and location of the pixels on your histogram, you can easily tell whether your photo is too dark, too bright, or somewhere in between. Below are a few examples of the histogram throughout different image exposures.
What’s The Ideal Histogram Reading
Asking for the ideal histogram reading is like asking what’s the ideal exposure. There’s no clear answer, but there’s a frame of reference you can follow. In photography, it’s important to have a balanced exposure to ensure there aren’t clipping any parts on your image. To avoid clipping, it’s typically best to have a more balanced exposure around the middle grey area. On your histogram, that would look something like this:
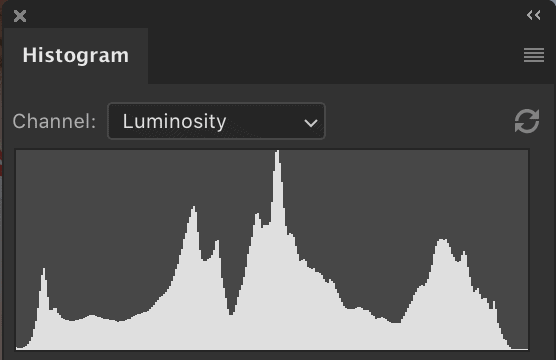
In this example, there aren’t any pixels at 0 (black) or 250 (white) on the histogram. This tells you that there’s no clipping in the exposure, and you’re capturing all possible details. In a dream world, this is how your histogram should look, but that’s rarely the case.
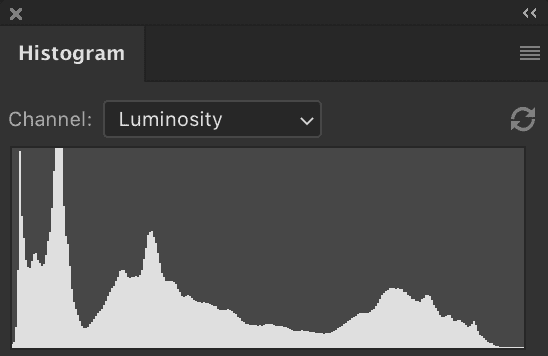
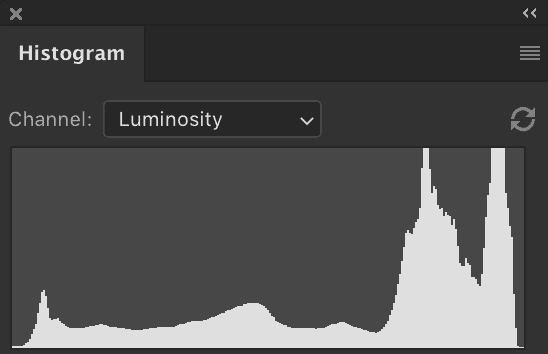
More commonly, your image will have a natural contrast that favors one side of your histogram over the other. Just because your histogram is reading heavily in the darks, it doesn’t mean you have a bad exposure. What matters most is that you are not crushing any of your shadows or highlights. Below are some common histogram examples you may find in your photography. None of these examples are ‘bad’, but they do favor one side of the histogram.
When To Use A Histogram
Once you know how to read a histogram, it’s important to know when to actually use one. A lot of the time, your light meter will give you enough information to capture a nice exposure. However, sometimes it doesn’t give you the most accurate readings when there is a lot of contrast in your photo.

The histogram comes in handy when you want to see the full range of your exposure. Unlike the light meter, your histogram will show you the values of your shadows, mid-tones, and highlights, to help you figure out if you need to make an exposure adjustment. The histogram will give you the most accurate display of your exposure, so it doesn’t hurt to use for most of your photos!
Where To Find Your Camera’s Histogram
Your camera’s histogram can be found in a couple of different places. Each is very easy to access and only requires the push of a button.
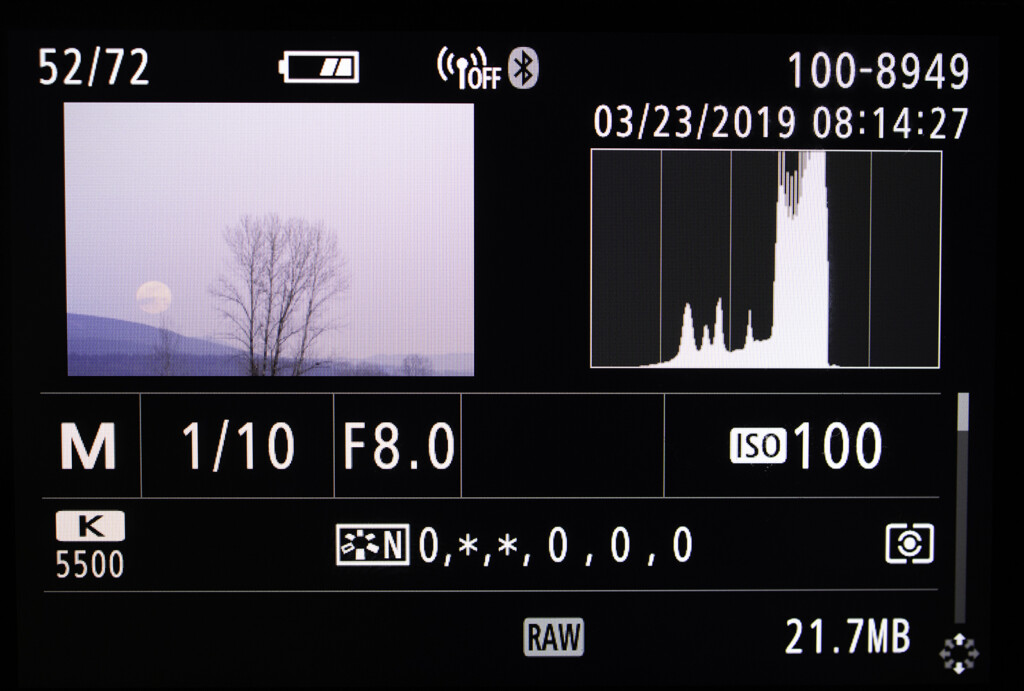
The first place you can find your camera’s histogram is in live view. Once in live view, press the INFO button on your camera until the histogram appears in the corner of your screen. If you don’t see the histogram, you may have to enable it in your camera’s menu settings.
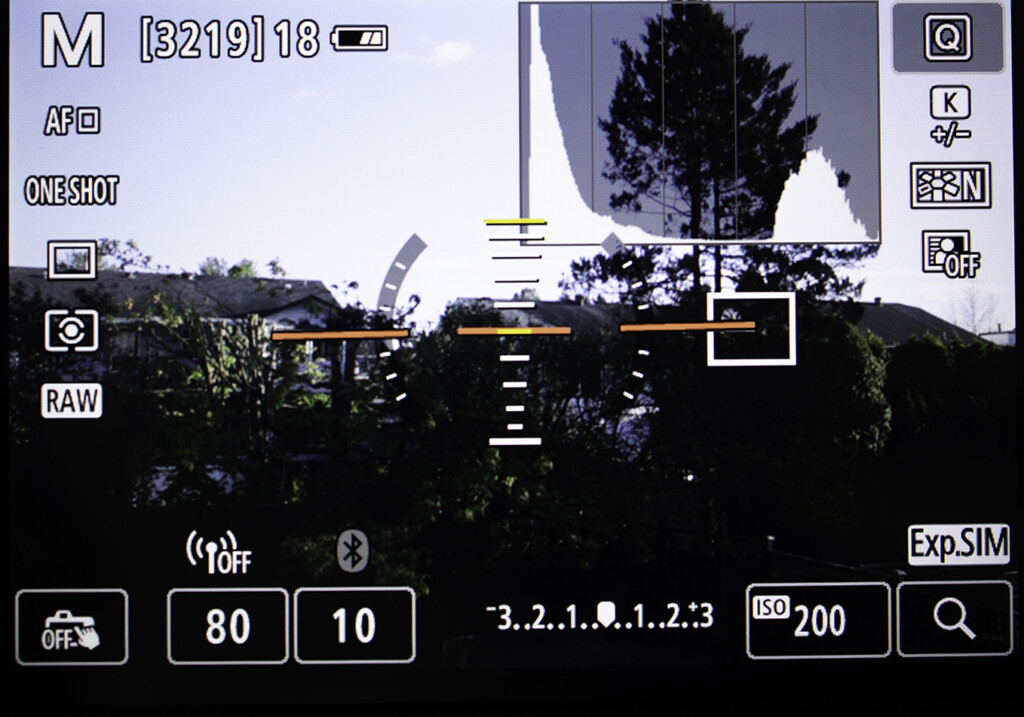
The second place you can find your histogram is on your image preview. When you are previewing a photo, once again, press the INFO button until a histogram appears on the screen. This histogram displays the exposure of the captured image you’re reviewing.
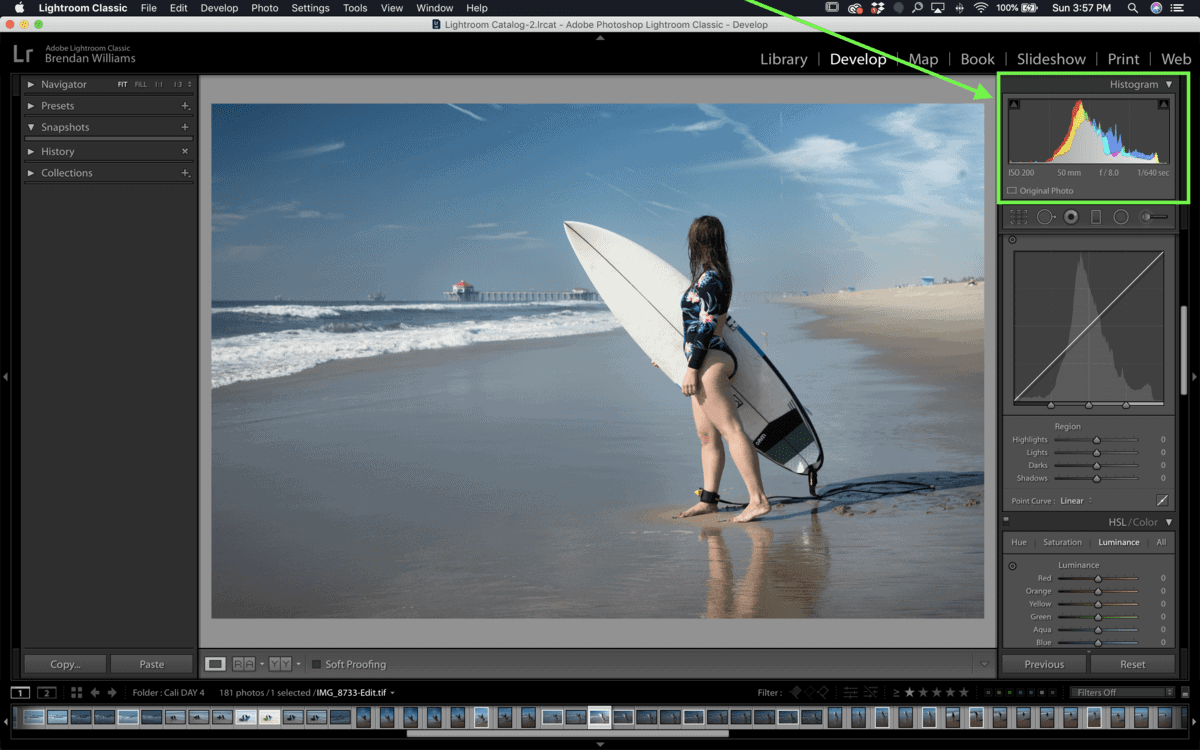
If you are editing your photo and want to see your histogram, Lightroom has a histogram conveniently placed in the top right corner. This histogram has a variety of colors along with the typical grey you’ll see on most histograms. This grey color represents the exposure values while the colored sections represent the number of pixels within a certain color range.
Learning how to read a histogram in photography makes it significantly easier to get your exposure right in-camera. There are huge benefits to getting your settings right before you take the photo, so you don’t have to rely on photo editing to fix any issues. This will give you a higher quality image with more details across your entire exposure range.
You can use a histogram in any photo you take, but they are especially useful when there’s a significant difference between the highlights and shadows. This often occurs when shooting outside or under a direct light source. If you’re new to using a histogram in your photography, try to use it in all of your photos, and then refine when you actually need it from there.








[…] When there’s a supreme lack of night, it can be challenging to know if you’re actually capturing the right exposure. In low light settings, it’s uncommon that your light meter offers any useful insight. That’s why you need to rely on a different tool called the histogram. […]