
Photographers have a very valuable tool available to help them edit their photos – the histogram in Lightroom. This is one of the more underrated editing companions because, while powerful, it can be hard to understand (especially for those looking at it for the first time).
The histogram can make adjusting your exposure much easier, indicating exactly where the exposure falls flat or is too much in your highlights, shadows, and mid-tones.
I’m here to show you how to use the histogram to your advantage, making your editing job easier and resulting in even better images.
What Is A Histogram?
In a nutshell, a histogram is a graphical representation of your photo’s exposure. The “hills and mountains” represent the shadows, highlights, and mid-tones. The graph aims to show you how dark, light, or just right each of these tones is.
The histogram isn’t just a tool that exists in Adobe’s software. You have one on your camera itself. While adjusting your exposure settings to take a photograph, you can view a histogram of the scene before taking the shot. This can give a better idea of whether the exposure settings are underexposing, overexposing, or a good middle ground for the image.
While the histogram on the camera aims to help you capture a better photo, the availability of this tool in both Lightroom Classic and Lightroom CC enables you to edit your image’s exposure more precisely.
Where Is The Histogram Located In Lightroom?
You can find the histogram in both Adobe Lightroom Classic and Adobe Lightroom CC, although the graph is located in different places between the two programs.
The Lightroom Classic Location
In Lightroom Classic, you can find the histogram in both the Library module and the Develop module.
The histogram in the Library Module is at the top of the right-side panel above Quick Develop.
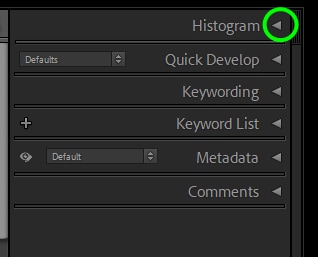

If this right side panel isn’t immediately visible, press the arrow icon in the middle of the right side of the program screen.

In the Develop module, the histogram is located in the same location but is now above the Basic tab. Again, if this right side panel is hidden, press the arrow symbol.

The Lightroom CC Location
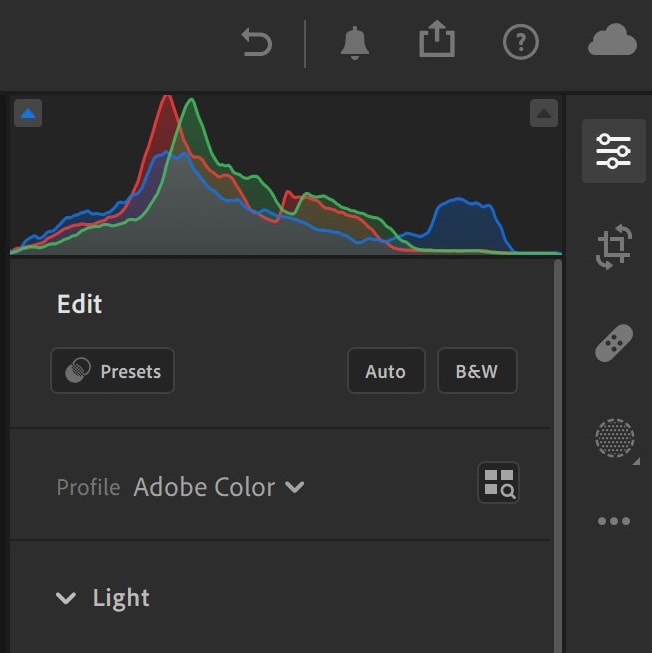
In Lightroom CC, finding the histogram is a bit trickier than in Lightroom Classic. For starters, in the main program view, you need to go into the Edit view. You can do so by clicking the icon with the three sliders on the right side of the screen.


From the edit view, you can find the histogram located in the right-hand corner above the Light tab.
If the histogram is not there or is hidden, don’t panic. You can restore the histogram view by clicking on the three horizontal dots to the very right of your screen.

This will bring up an options window from which you can restore the histogram view. You can also press Control + 0 (Win) or Command + 0 (Mac).

How To Read The Histogram In Lightroom
Reading the histogram is not as complex as it may seem on the surface. The histogram is divided into three primary sections:
Shadows:

Mid-tones:

Highlights:

Technically the histogram is divided into five sections because the chart is a very detailed representation. On the far right side are your Whites (brighter than highlights), and on the far left are your Blacks (darker than shadows).
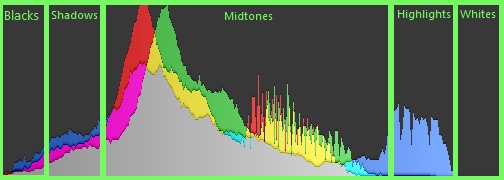
But it is easiest to think of the chart as being made up of three primary sections when editing.
The peaks and valleys of the “mountains” represent how much shadows, highlights, and mid-tones are present in a photo.
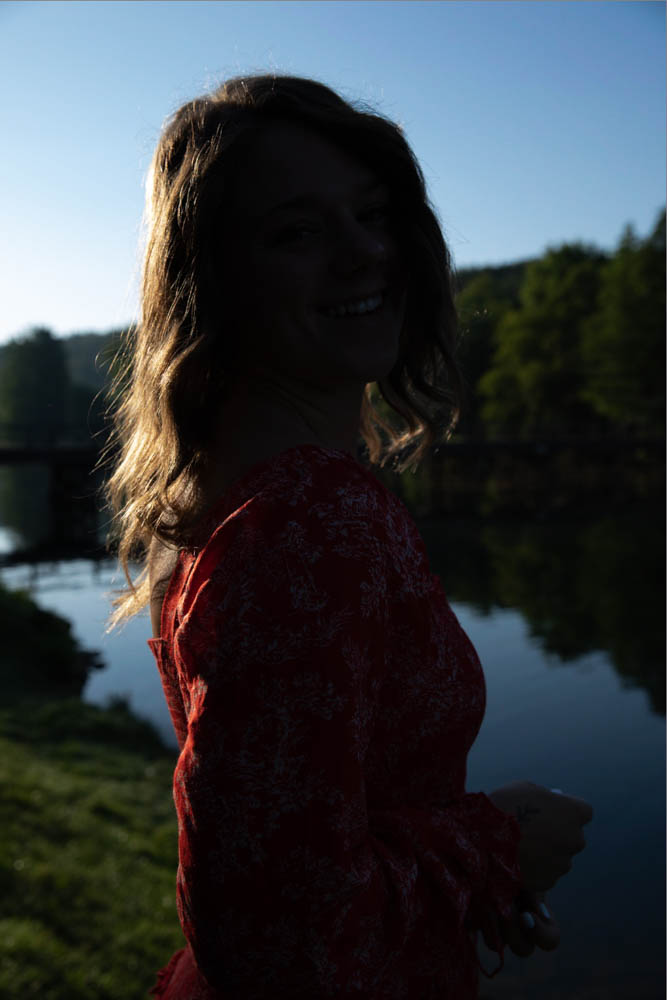
If you have a lot of tall peaks on the left side of the screen, that means your image is underexposed. You have a lot of shadows and not a lot of highlights or mid-tones. Here is an example of an underexposed image with the histogram skewed to the left as a result:
On the contrary, an overexposed image would have a histogram that is skewed to the right. This indicates that there are a lot of bright tones in the picture.
An image lacking contrast will have a histogram with no peaks and mountains on the shadows or highlights (far-left and far-right sides of the screen). The tall peaks will be in the mid-tones.

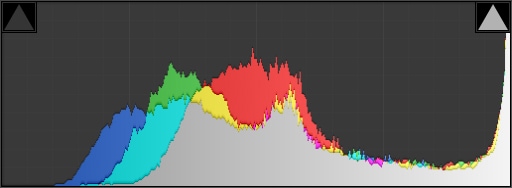
An image with a good or even exposure will have a cluster of mountains, more so in the middle of the histogram, spreading across the entire chart.


The Histogram And Color
Notice that the histogram graphs also have “mountains” with colors. The colors represented are red, green, and blue (primary colors). Where they mix, you’ll find yellow, cyan, and magenta. The gray is where all of these colors mix.
This indicates how much of that color (or colors) is present in that tone. So, the histogram has the added bonus of representing color distribution in your tones!
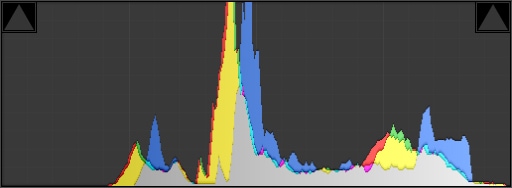
For example, you can see a lot of blues in the Highlights section of this photo. That states that the highlights have blue in them.

The Histogram And Clipping
The histogram also indicates a tonal issue known as Clipping. Clipping is when there is a loss of information or detail on the extreme end of the shadow spectrum and/or the highlight spectrum.
Generally speaking, photos look best when you can see detail in the entire range of tones, from the darkest to the lightest. If your shadows are clipped, that means you have lost information in the darkest part of your image. Likewise, if your highlights are clipped, that means your image is overexposed.
The histogram indicates when your shadows or highlights are clipped with an arrow icon on either side of the screen.

The arrow turns gray on the left side when your shadows are clipped.

When your highlights are clipped, the right arrow is gray.

How To Edit Your Photos Using The Histogram In Lightroom
With all of the information that the Lightroom histogram shows, editing becomes a lot more technical. You can see in real-time how your exposure adjustments impact the image, not just by the changes within the image itself but also by how the graph adjusts.
Use the histogram to fix the tones in your image that are shown to be an issue. The histogram also helps you edit by stopping you from going overboard with your adjustments and causing blown highlights or dark shadows.
For example, let’s take this underexposed photo, and I’ll walk you through how the histogram helps me fix it:
As you can see, there are too many blacks and shadows here, so the image appears very dark. The gray arrow on the left side is marked, indicating clipping there.
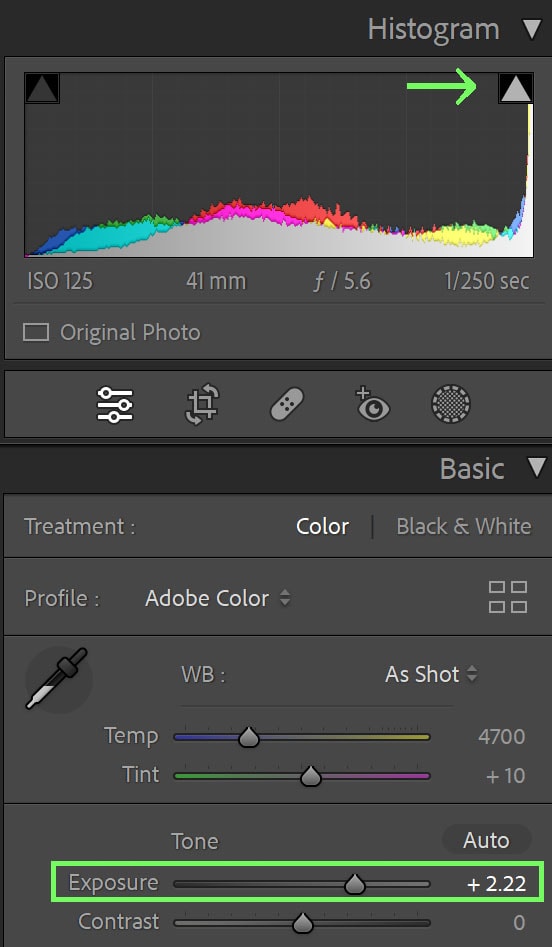
To adjust this, I will go to my Basics tab and move the Exposure slider to the right to lighten the image. I move the slider until the clipping arrow on the left side is no longer gray.
But, as I moved the exposure slider to the right, more highlights and whites appeared, which meant that although my shadows were corrected, my highlights and whites suffered because the arrow now indicates clipping on the right side of the histogram.

To counteract this, I pulled my Whites and Highlights sliders down until the arrows no longer showed clipping.

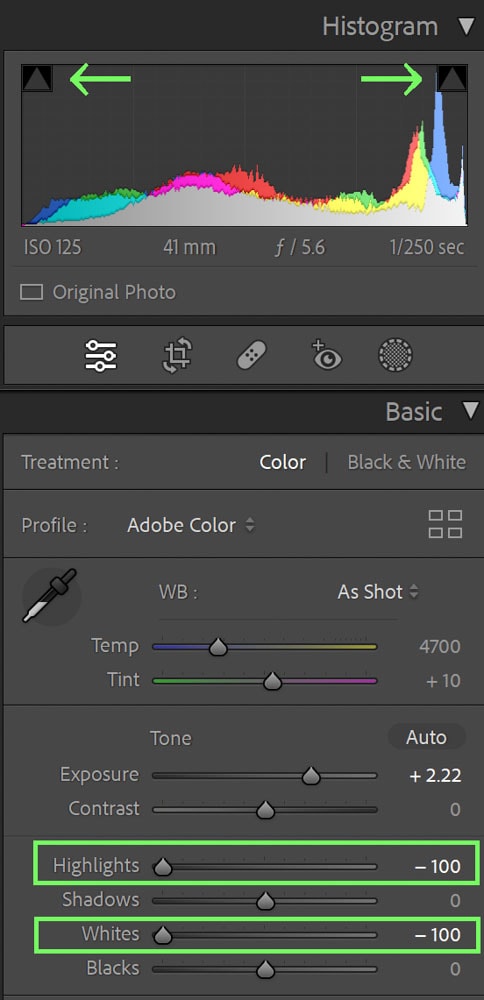
This resulted in my histogram showing that there is no more clipping present in my image (because neither arrow was colored light gray) and that my picture is now well exposed.
For the overexposed image, I used the histogram to see how far I could edit that image to my liking without causing more clipping.
The original:
After my edit:


The above being said, the histogram is not a law you have to follow. The histogram is more of a guide, suggestion, or reference and should be treated as such.
There are situations where following the histogram perfectly won’t do you any favors – such as editing in a Light and Airy style, landscape sunset images, or adjusting nighttime photographs.
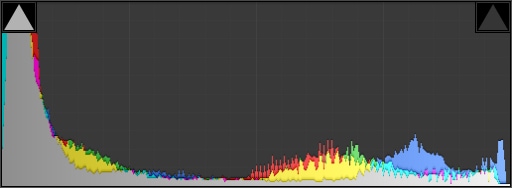
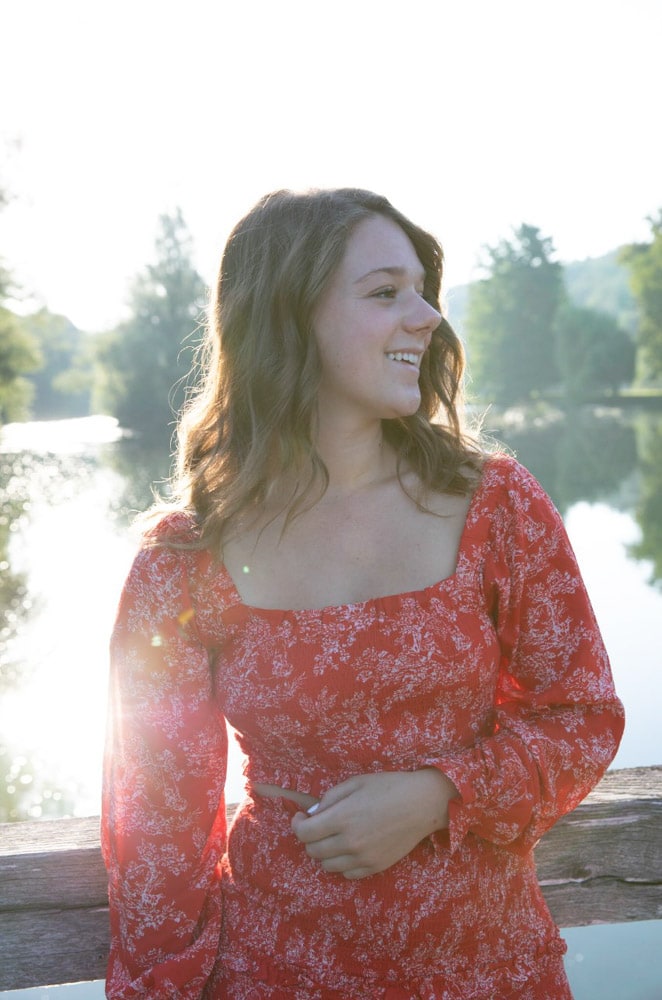
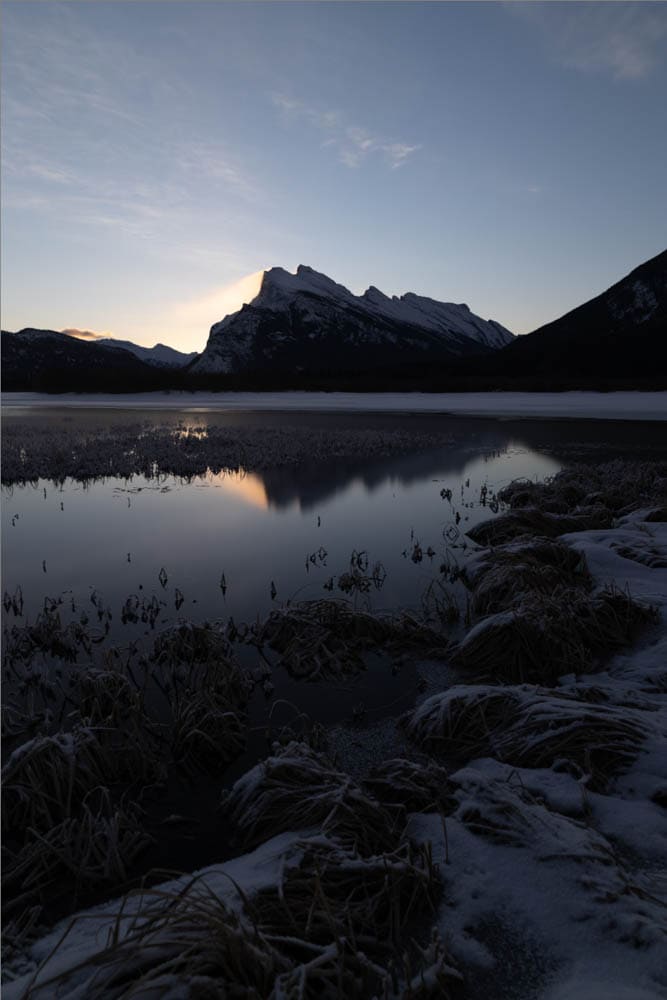
For example, how I would edit a photograph like this is not conducive to what the histogram tells me.
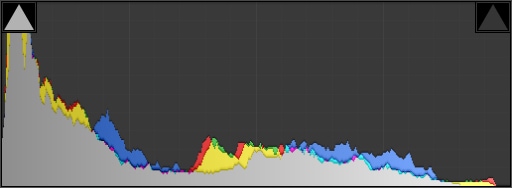
My edit would result in a histogram that looks like this, showing that I didn’t resolve the shadow clipping – but that’s because I felt like the shadows enhance the image.


Editing is as much a matter of opinion and aesthetic as it is what a computer graph tells you – use your best judgment.
Using The Histogram Clipping Warnings In Lightroom To Improve Your Exposure
To elaborate a little bit further on clipping, the Lightroom histogram can show you exactly where the clipping is happening directly in your image.
Let’s take the overexposed image once more.
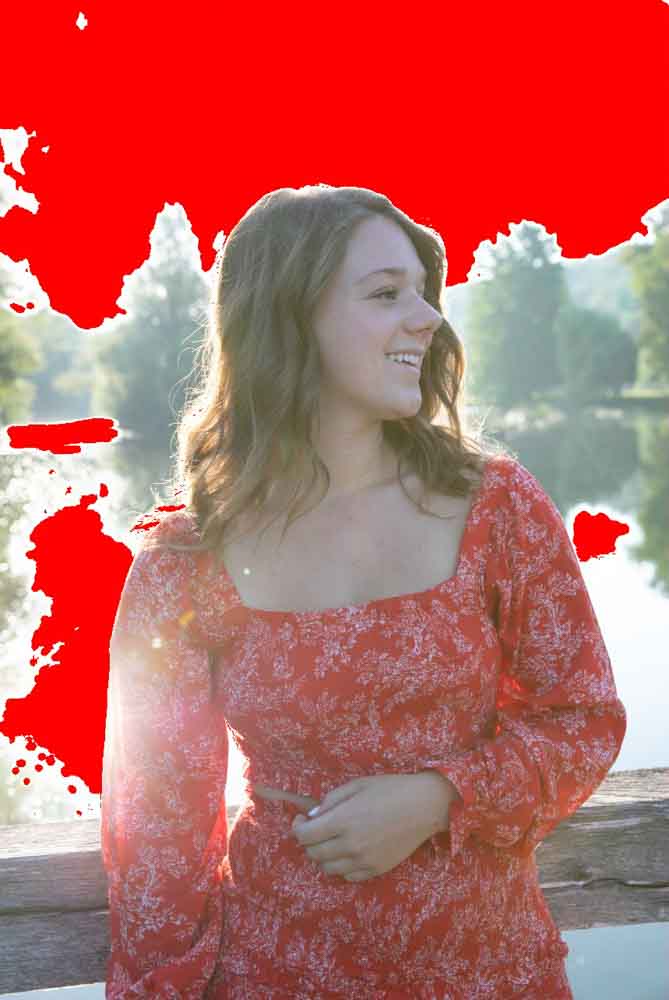
If you hover your mouse over the clipping arrow on the right side, the photo lights up to indicate exactly where the highlights are clipped. Highlights are clipped in red.
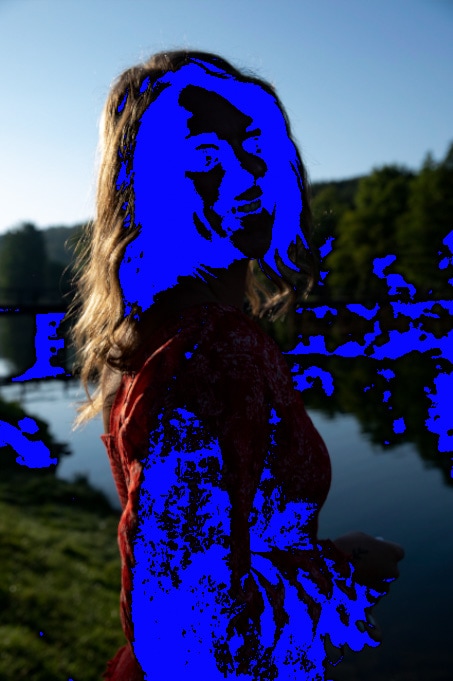
You can do the same for the shadows, which are clipped in blue.
If you need the clipping highlights (or shadows) to remain visible after you move the mouse, just press the arrow.

As you edit and adjust your image, the bright red or blue will disappear (because you’ve fixed the clipping issue) or appear even more prominent (because you’re causing clipping). You can use these clipping warnings to gauge your edit’s progress.
Clipping warnings can also be very important for those looking to print the photo they are editing. Clipped highlights and shadows will not print well because of the lack of detailed information. Adjusting clipped highlights and shadows before printing helps save you money from having to reprint an image because it didn’t come out correctly.